vendure-data-hub-plugin
Monitoring & Logs
Track pipeline executions, view logs, and debug issues.
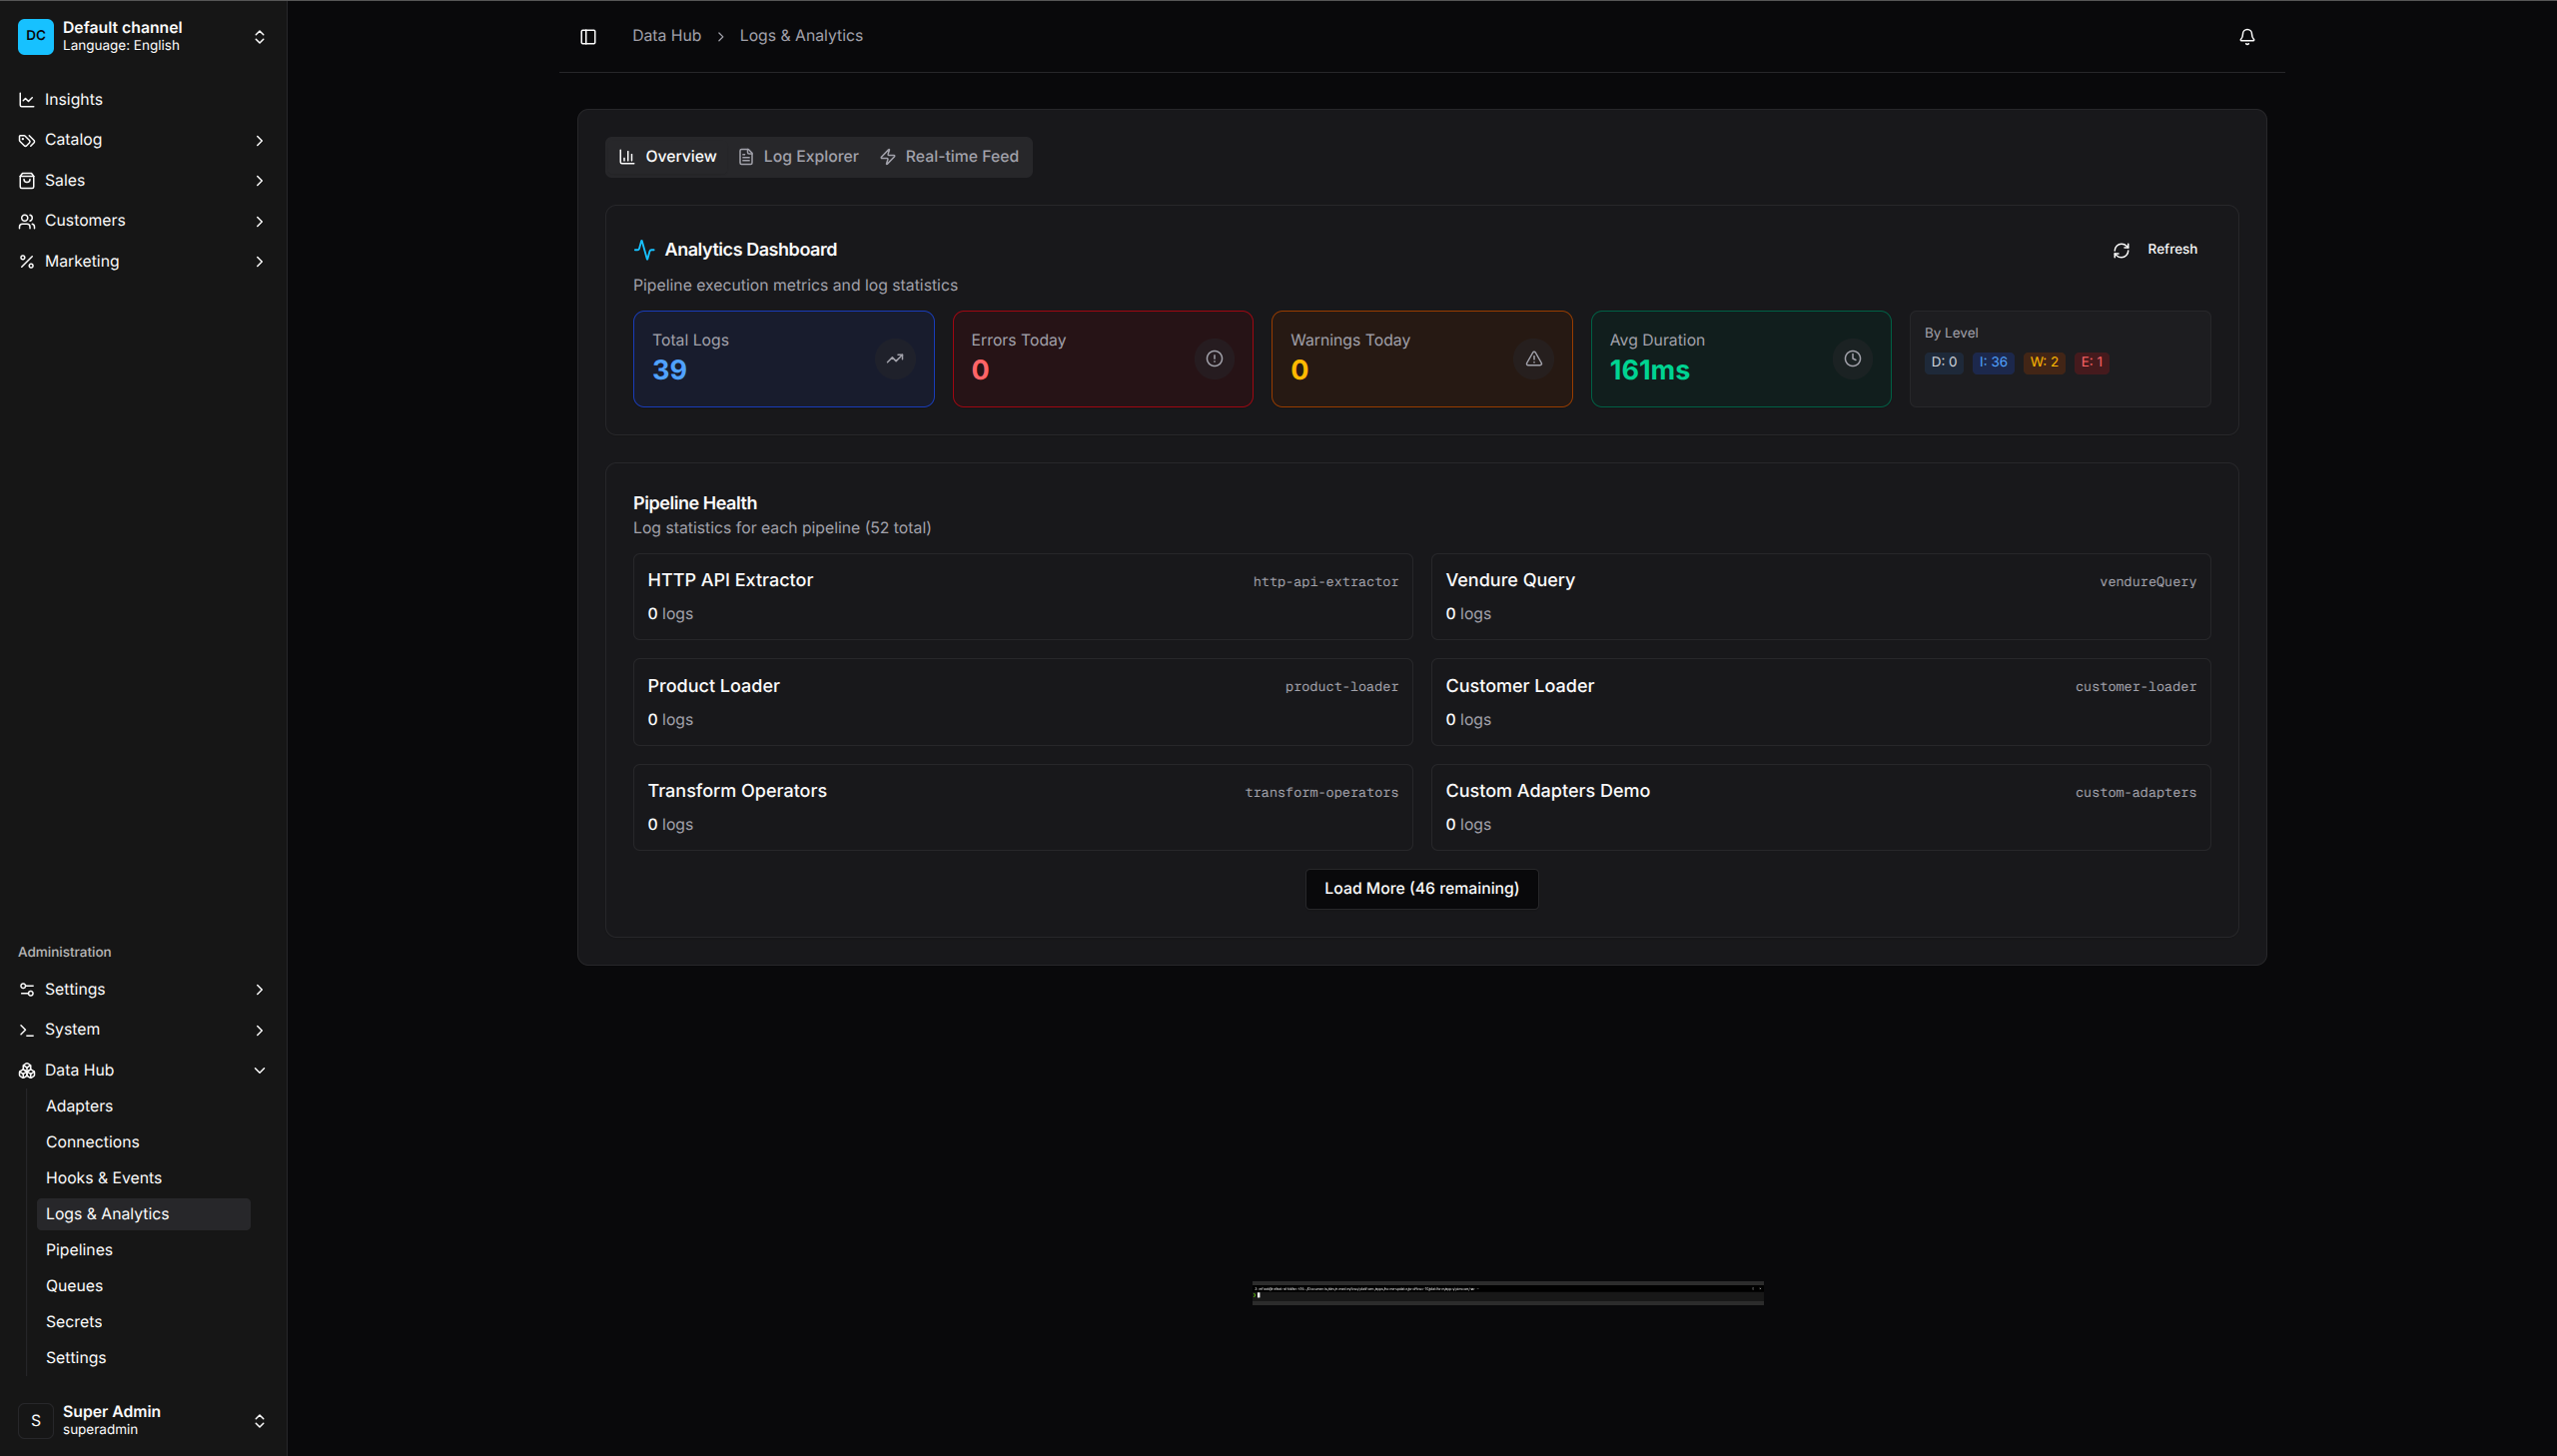
Analytics Dashboard - Real-time metrics and pipeline health overview
Run History
Viewing Runs
- Go to Data Hub > Runs
- See all pipeline executions
- Filter by:
- Pipeline
- Status (running, completed, failed)
- Date range
Run Details
Click a run to see:
- Status - Current state
- Timing - Start, end, duration
- Metrics - Records processed, failed
- Steps - Per-step execution details
- Logs - Execution logs
Run Statuses
| Status | Description |
|---|---|
| Pending | Scheduled, waiting to start |
| Running | Currently executing |
| Completed | Finished successfully |
| Failed | Stopped due to error |
| Cancelled | Manually stopped |
| Partial | Completed with some failures |
Execution Logs
Viewing Logs
- Open a run
- Click Logs tab
- View chronological log entries
Log Levels
| Level | Description |
|---|---|
| Debug | Detailed debugging information |
| Info | General execution information |
| Warning | Potential issues that didn’t stop execution |
| Error | Errors that caused record failures |
Filtering Logs
Filter logs by:
- Level (debug, info, warn, error)
- Step (extract, transform, load, etc.)
- Time range
- Search text
Log Retention
Logs are retained based on plugin settings:
- Configure in Data Hub > Settings
- Default: 30 days
- Adjust based on debugging needs and storage
Step Metrics
Each step tracks:
| Metric | Description |
|---|---|
| Records In | Records received from previous step |
| Records Out | Records passed to next step |
| Records Failed | Records that failed processing |
| Duration | Time spent in this step |
| Throughput | Records per second |
Viewing Step Details
- Open a run
- Click Steps tab
- See per-step breakdown
- Click a step for detailed metrics
Error Tracking
Viewing Errors
- Go to Data Hub > Errors
- See all failed records across pipelines
- Filter by:
- Pipeline
- Step
- Error type
- Date range
Error Details
Click an error to see:
- Record Data - The original record that failed
- Error Message - What went wrong
- Stack Trace - Full error details
- Context - Pipeline, step, run information
Retrying Records
- Select one or more error records
- Click Retry Selected
- Failed records are reprocessed
Or retry from the run view:
- Open the failed run
- Click Retry Failed Records
Deleting Errors
- Select error records
- Click Delete Selected
- Confirm deletion
Use this for records that cannot be fixed (bad source data).
Analytics
Dashboard Metrics
Go to Data Hub > Analytics to see:
- Run Success Rate - Percentage of successful runs
- Average Duration - Typical run time
- Records Processed - Total over time period
- Error Rate - Percentage of failed records
Pipeline Performance
View per-pipeline metrics:
- Run history chart
- Average records per run
- Average duration trend
- Error rate over time
Step Performance
Identify bottlenecks:
- Slowest steps across pipelines
- Steps with highest error rates
- Throughput by step type
Alerts
Setting Up Alerts
Configure notifications for pipeline events:
- Go to Data Hub > Settings > Alerts
- Configure alert conditions:
- Run failed
- Error rate exceeds threshold
- Run duration exceeds threshold
- Set notification channels:
- Webhook
- Slack (via webhook)
Alert Conditions
| Condition | Trigger |
|---|---|
| Run Failed | Any run fails |
| High Error Rate | Error rate exceeds X% |
| Long Duration | Run exceeds X minutes |
| No Runs | Pipeline hasn’t run in X hours |
Debugging Tips
Common Issues
No records extracted:
- Check extractor configuration
- Verify connection settings
- Test the data source manually
- Check
itemsFieldpath is correct
Records failing validation:
- View error details
- Check validation rules
- Sample the source data
- Adjust validation or source data
Records not loading:
- Check loader configuration
- Verify field mappings
- Check for required fields
- Review load strategy
Slow execution:
- Check step durations
- Identify bottleneck steps
- Adjust batch sizes
- Review concurrency settings
Debug Mode
Enable debug logging for detailed output:
DataHubPlugin.init({
    debug: true,
})
Or per-pipeline in the trigger configuration.
Dry Run
Test pipelines without making changes:
- Clone the pipeline
- Remove or disable load steps
- Run the copy
- Review what would have happened
Sample Data
Preview data at each step:
- Open the pipeline editor
- Click Preview on a step
- See sample records
- Verify transformations
Best Practices
Regular Monitoring
- Check the dashboard daily
- Review error queue weekly
- Analyze performance monthly
Alert Configuration
- Set up alerts for critical pipelines
- Don’t alert on expected failures
- Use appropriate thresholds
Log Management
- Configure appropriate retention
- Export logs for long-term storage
- Search logs during debugging
Error Handling
- Review errors promptly
- Categorize recurring errors
- Fix root causes, not just symptoms